
I spent three hours hiking up a ridge in the Cascades last Tuesday, only to sit there in the biting wind listening to nothing but the hiss of a dead band. I’d checked the charts, seen the green lights, and convinced myself I knew exactly how to read propagation forecasts before I even packed my gear. But the charts didn’t account for the local solar flare that turned the ionosphere into a brick wall, and my expensive, high-gain antenna—mounted a full ten meters up, mind you—wasn’t going to save me from a bad forecast. Most of the “expert” guides out there treat these predictions like gospel, but if you treat a forecast like a guarantee instead of a statistical suggestion, you’re going to end up cold, tired, and frustrated.
I’m not here to sell you on some magic software or a subscription to a premium data service. My goal is to show you how to look at the numbers, the solar cycles, and the real-time indicators to build a mental model that actually works. I’ll teach you how to spot the difference between a genuine opening and a statistical fluke, so you can stop wasting your precious operating time chasing ghosts.
Table of Contents
- Deciphering Propagation Prediction Charts Beyond the Surface Level
- Predicting Hf Frequency Availability Through Actual Data
- Five Real-World Rules for Not Getting Fooled by a Pretty Chart
- The Bottom Line Before You Pack Your Gear
- The Gap Between the Chart and the Noise Floor
- Beyond the Charts
- Frequently Asked Questions
Deciphering Propagation Prediction Charts Beyond the Surface Level

When you open a site like VOACAP or glance at a solar cycle graph, don’t just look at the colors and assume the band is ready for you. Most people see a green block on a chart and think, “Great, 20 meters is open,” but they forget that these models are just mathematical guesses based on current data. You need to start understanding solar flux index trends rather than just looking at today’s snapshot. If the SFI is climbing steadily, those higher bands will stay stable, but if it’s jittery, you’re going to see bands open and close like a faulty relay.
I’ve spent too many nights on a ridge waiting for a signal that never came because I ignored the nuances of predicting HF frequency availability. You have to look at the relationship between the MUF (Maximum Usable Frequency) and the current ionospheric conditions for HF radio. If the chart shows a high MUF but the signal is nothing but noise, it’s likely that the local layer is too thin or the spread is too wide for your specific antenna setup. Don’t treat the chart as a guarantee; treat it as a suggestion.
Predicting Hf Frequency Availability Through Actual Data
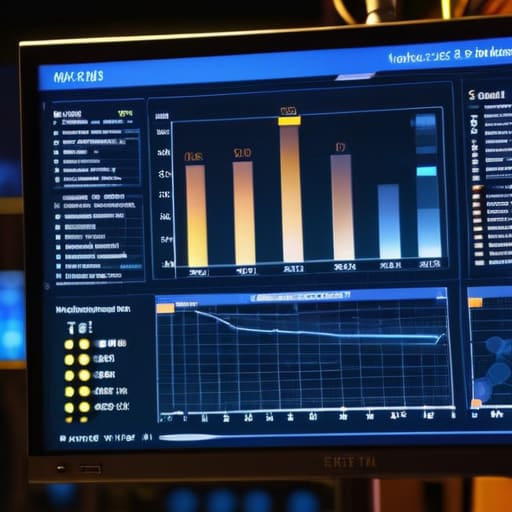
If you want to move past the guesswork, you have to look at the numbers that actually drive the physics. Most people glance at a colorful map and call it a day, but if you’re serious about predicting HF frequency availability, you need to start looking at the Solar Flux Index (SFI). I don’t care how pretty the forecast looks; if that SFI is dipping below 70, don’t expect the high bands to behave, regardless of what the “expert” charts say. The SFI tells you how much energy is hitting the atmosphere, and without that energy, the ionosphere is just a thin, useless layer of gas.
I also spend a lot of time interpreting ionospheric sounding data when I’m trying to decide if a specific window is worth the setup time. Looking at the critical frequency (foF2) tells me more about whether a band will actually stay open than any generalized weekly outlook ever could. It’s the difference between setting up a heavy wire antenna on a ridge and sitting in your shack wondering why you’re only hearing local noise. You have to respect the data, because the sun doesn’t care about your schedule.
Five Real-World Rules for Not Getting Fooled by a Pretty Chart
- Stop treating the color-coded maps like a weather report for your backyard. Those charts show what the math says should happen under ideal conditions, but they don’t account for the local terrain or the specific way your antenna is interacting with the ground. If the chart says 40 meters is a sea of green but you’re only pulling up local noise, trust your ears, not the pixels.
- Check the solar flux index, but don’t marry it. A high sunspot number is a good sign, but it’s a lagging indicator. I’ve seen days where the numbers looked fantastic on paper, yet the bands were as quiet as a graveyard because the ionospheric layers hadn’t settled into a stable state yet. Watch the trend, not just the single daily number.
- Look for the “gray areas” in the predictions. If a forecast shows a sudden, sharp transition from a wide-open band to a dead one, treat that with skepticism. Real propagation shifts are rarely that clean. When you see those jagged edges on a prediction model, it usually means the model is struggling with high uncertainty—that’s your cue to stay on standby rather than committing to a long, heavy setup.
- Correlate the forecast with your own signal-to-noise reality. If the prediction says the band is open but you’re fighting a rising noise floor, the forecast might be right about the ionosphere, but it’s ignoring the fact that local atmospheric conditions or even your own power supply are making the band unusable. A “good” forecast is useless if your local environment is screaming.
- Always keep an eye on the MUF (Maximum Usable Frequency) vs. your actual operating frequency. If you’re planning to run DX on 20 meters and the forecast shows the MUF hovering right around 18 MHz, don’t be surprised when your signal disappears halfway through the session. I’ve learned the hard way that “close enough” in a forecast usually means “not working” in practice.
The Bottom Line Before You Pack Your Gear
Stop treating prediction charts like gospel; they are probabilistic models, not crystal balls, and a “green” band on a map doesn’t mean a thing if your local noise floor is screaming.
Always cross-reference the forecast with real-time data like solar flux indices and actual signal reports, because the ionosphere doesn’t care what a computer model predicted three hours ago.
Remember that your setup matters as much as the forecast—a perfect prediction won’t save a poorly tuned antenna or a wire hung too close to the ground.
The Gap Between the Chart and the Noise Floor
A propagation forecast is a weather report for something you can’t see, and just like a rain forecast, it doesn’t mean you’re going to get wet; if the model says 40 meters is wide open but you’re sitting there listening to nothing but the hiss of the noise floor, trust your ears over the colorful pixels on your screen every single time.
Wren Castellano
Beyond the Charts
At the end of the day, reading a forecast isn’t about finding a magic number that guarantees a contact; it’s about narrowing down your search area so you aren’t wasting battery power on a dead band. We’ve looked at how to spot the difference between a theoretical opening and a real one, and why you need to treat those colorful DSP models with a healthy dose of skepticism. Remember, a forecast tells you what the ionosphere is supposed to be doing, but it won’t tell you if a local solar flare just threw a wrench in your plans or if your antenna is poorly tuned for the current MUF. Use the data to pick your frequencies, but keep your ears tuned to the actual noise floor to see if the reality matches the prediction.
There is a specific kind of magic that happens when you finally bridge that gap—when you stop staring at a screen and actually hear a faint, rhythmic signal cutting through the static from a continent halfway around the world. It’s a feeling that no piece of software can replicate, and it’s why we bother with all this math and measurement in the first place. Don’t let the technicalities turn the hobby into a chore; use the science to get you to the edge of the band, and then let the luck of the draw take it from there. Get out there, get your antenna up, and see what the sky is actually telling you.
Frequently Asked Questions
If the solar flux index looks great but I'm still getting nothing but noise, is the forecast just wrong or am I missing something with my antenna setup?
It’s rarely just the forecast. A high SFI means the ionosphere is primed, but it doesn’t guarantee a path to your specific station. If the numbers look good and you’re still staring at a noise floor, check your local geometry. Are you running a wire 3 meters off the ground when you need 10? If your antenna isn’t high enough to clear the local terrain, even a solar maximum won’t save you from a dead signal.
How much weight should I actually give to these long-term 3-day forecasts versus just watching the real-time signal strength on the band?
Look, a three-day forecast is a weather report, not a promise. It tells you if the atmospheric conditions are primed for a good show, but it won’t tell you if the curtain actually opens. I treat long-term forecasts as a way to decide which gear to pack, but I don’t touch the key until I’ve seen the real-time signal strength. If the chart says 20m is open but you’re only hearing the noise floor, trust your ears, not the graph.
Does the time of day actually matter if the charts say the band is "open," or am I just chasing ghosts?
It matters immensely. A chart saying a band is “open” is a mathematical probability, not a guarantee. If the chart shows a window at 14:00 UTC but you’re sitting there at 22:00, you’re chasing ghosts. Propagation is a moving target governed by solar angles and ionospheric layers that shift constantly. Even if the data looks perfect, if your local time doesn’t align with the predicted peak, you’re just listening to the noise floor.
