I remember sitting in a cramped, humid shack back in the late nineties, staring at a spectrum analyzer that cost more than my first car, trying to figure out why my signal looked like a jagged mess instead of a clean sine wave. I had all the textbooks, but none of them told me how to actually see what my rig was doing to the local noise floor. People will try to sell you on the idea that you need a high-end, rack-mounted laboratory setup to understand your own footprint, but honestly, when people ask me what is a station monitor, they’re usually looking for a way to stop guessing. You don’t need a PhD or a massive budget; you just need a way to verify that your gear is actually doing what the manual claims it is, rather than just shouting into the void.
In this post, I’m stripping away the marketing fluff to give you the practical reality of monitoring your station. I won’t bore you with theoretical physics that doesn’t apply to a wire antenna on a hill; instead, I’ll show you how to use what you have to catch interference and signal distortion before they ruin your contact. My promise is simple: I will tell you what tools actually provide useful data and which ones are just expensive paperweights.
Table of Contents
- Real Time Signal Visualization vs Guessing at Your S Meter
- Amateur Radio Monitoring Tools That Actually Yield Data
- Five ways to actually use a monitor without wasting your time
- The bottom line: Stop guessing and start measuring
- Beyond the S-meter myth
- Bottom Line: Data Over Guesswork
- Frequently Asked Questions
Real Time Signal Visualization vs Guessing at Your S Meter
We’ve all been there: staring at a flickering S-meter, watching a needle jump, and trying to figure out if that’s a weak DX station or just a local burst of impulse noise from your neighbor’s refrigerator. An S-meter is a blunt instrument; it’s a single number representing total power, but it tells you absolutely nothing about the character of what’s hitting your front end. You’re essentially flying blind, guessing whether you’re looking at a narrow-band signal or a wideband interference spike that’s masking everything else.
This is where the shift toward real-time signal visualization changes the game. When you move from a simple signal strength indicator to something like a waterfall display or a dedicated spectrum view, you stop guessing. Instead of wondering if a signal is actually there, you can see its footprint. Comparing a spectrum analyzer vs station monitor utility often comes down to this: one tells you how much energy is present, while the other shows you exactly where that energy is sitting in the frequency domain. If you can see the shape of the signal, you can finally tell the difference between a legitimate contact and a ghost in the noise floor.
Amateur Radio Monitoring Tools That Actually Yield Data
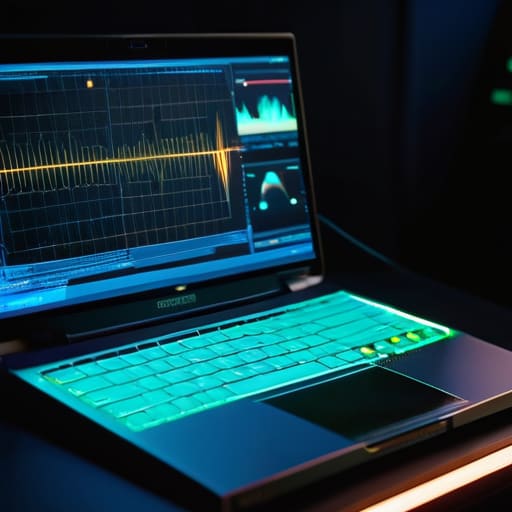
If you’re looking for actual utility, you have to move past the basic signal strength indicators built into your transceiver. Those little bars on your screen are fine for a rough idea, but they’re notoriously non-linear and won’t tell you if you’re looking at a clean signal or a massive burst of local interference. To get real data, you need tools that show you the shape of the noise. For most of us, that means leaning into SDR-based software. A decent RTL-SDR or an Airspy plugged into a laptop gives you a level of real-time signal visualization that makes a standard waterfall display look like a child’s drawing.
When people ask about the difference between a spectrum analyzer vs station monitor, they’re usually looking for precision. A dedicated spectrum analyzer is a lab-grade beast meant for finding harmonics or checking filter skirts, but for daily station management, your best amateur radio monitoring tools are actually high-bandwidth SDRs paired with decent logging software. I’ve spent many evenings on a ridge with a portable rig, and I can tell you: if you aren’t seeing the actual bandwidth of the signal on your screen, you aren’t monitoring; you’re just guessing.
Five ways to actually use a monitor without wasting your time
- Stop trusting the S-meter alone. An S-meter is just a voltage reading that tells you how much energy is hitting the detector, not necessarily how much signal you’re actually pulling in. A proper monitor—whether it’s a dedicated hardware unit or a software waterfall on your SDR—shows you the actual bandwidth and the noise floor, which is the only way to know if you’re looking at a signal or just a spike of local interference.
- Watch your noise floor, not just the peaks. I’ve spent too many nights chasing a signal that turned out to be nothing more than a poorly shielded switching power supply in my own shack. If your monitor shows the noise floor jumping every time your fridge kicks in, you aren’t “hearing” more stations; you’re just seeing your own house’s electrical mess.
- Use a monitor to verify your antenna’s performance. If you change your feedline or move your antenna from 10 meters to 5 meters above ground, you need to see the change in the local noise environment. If the noise floor drops, your antenna is likely better decoupled from the local interference; if it rises, you might be picking up more RFI than actual DX.
- Monitor the “quiet” times to understand your environment. Don’t just turn the monitor on when you’re hunting for a contact. Leave it running during the quiet hours to establish a baseline. You need to know what “normal” looks like in your specific location so that when the ionosphere shifts or a new neighbor installs a solar inverter, you can actually identify the change.
- Don’t overspend on “pro” features you’ll never touch. You don’t need a high-end laboratory spectrum analyzer to monitor a station. If you’re working HF, a decent SDR with a clean waterfall display provides more than enough data to see what’s happening. Save your money for better coax or a higher mounting point for your dipole; those will do more for your signal-to-noise ratio than a $2,000 piece of gear ever will.
The bottom line: Stop guessing and start measuring
An S-meter is a glorified suggestion; a real station monitor gives you the actual signal strength and noise floor data you need to know if you’re actually making progress or just fighting a local interference source.
Don’t buy a “monitoring solution” just because the marketing says it’s professional; if it doesn’t show you the relationship between your signal and the noise floor in real-time, it’s just another expensive way to look at pretty colors.
Remember that even the best monitoring gear can’t fix a bad antenna setup—if your signal looks garbage on the monitor, check your height above ground and your feedline before you start blaming the receiver.
Beyond the S-meter myth
A station monitor isn’t just another gadget to clutter your desk; it’s the difference between blindly trusting a needle that’s been calibrated since the Reagan administration and actually seeing the shape of your signal against the noise floor. If you aren’t looking at the real-time data, you aren’t monitoring your station—you’re just guessing.
Wren Castellano
Bottom Line: Data Over Guesswork
At the end of the day, a station monitor isn’t about collecting more gadgets to clutter your workbench; it’s about moving from guessing to knowing. We’ve talked about why relying on a generic S-meter is a losing game and why you need tools that actually give you a window into what’s happening on the airwaves. Whether you’re using a dedicated hardware monitor or an SDR setup to visualize your signal, the goal is the same: you want to see if your antenna is actually performing at the height you’ve mounted it, or if you’re just fighting a high noise floor you haven’t identified yet. Stop chasing ghosts and start measuring the reality of your RF environment.
Radio is a beautiful, messy science, and part of that mess is the unpredictability of the ionosphere or a sudden spike in local interference. You can’t control the sun, but you can control how much you actually understand about your own station. Don’t let the complexity of the gear intimidate you; just start with one reliable way to see what you’re actually putting out there. Once you stop operating in the dark, you’ll find that the hobby becomes a lot more rewarding—and a lot more predictable—even when the conditions aren’t. Get the data, trust your eyes, and then go get back on the air.
Frequently Asked Questions
Do I actually need a dedicated hardware monitor, or can I just use an SDR dongle and some software to get the same data?
Look, if you’re just checking if a band is busy, an SDR dongle and some software will do the job just fine. It’s cheap, it’s visual, and it’s plenty for most of us. But if you’re trying to troubleshoot a noisy power supply or a poorly shielded transceiver, that’s where the dedicated hardware comes in. A good hardware monitor has the dynamic range to show you the real problem, whereas an SDR might just clip and call it a day.
How much does my antenna's height and local noise floor skew the readings I'm seeing on the monitor?
It’s everything. If you’re sitting in a backyard with a wire antenna six feet off the ground, your monitor is mostly just reporting the local noise floor and ground losses, not the signal you’re hunting. I’ve seen people swear their rig is failing when, in reality, they’re just drowning in RFI from a nearby switching power supply. If you don’t account for your antenna’s height and the local noise, you aren’t measuring signal—you’re just measuring your environment.
Is there a point where I'm over-analyzing the signal and just wasting time that should be spent on the air?
Look, I’ve spent more hours than I care to admit staring at a waterfall display, trying to figure out if a spike is a local interference source or a DX station barely above the noise floor. If you’re tweaking your filters for twenty minutes just to shave off a decibel of noise, you’re not operating; you’re procrastinating. If the signal is readable and your SWR is stable, get off the analyzer and make the contact.
